We have a unique 3DTI testbed. We showcase our 3DTI system, TEEVE, to different public events. In this page, we accumulate the data traces collected (using our monitoring application) at different events. Please email marefin2@illinois.edu or klara@illinois.edu, if you are interested in getting any of these traces below.
Traces Collected in ACM Multimedia 2011 Demo
Venue: Scottsdale, Arizona
Date: November 29, 2011
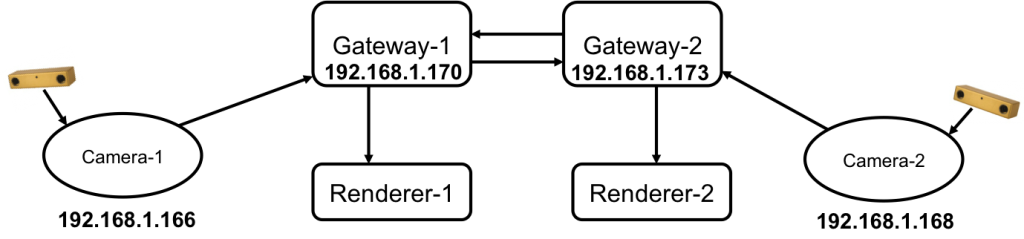
Demo Setup: We use two tele-immersive (TI) sites each containing one camera (bumblebee), one renderer and one gateway. The setup is shown in Figure 1.
Demo Activity: We use virtual lightsaber dual fight between the participants. Each participant was to wear a lab coat with colored patches on it. The goal of each participant was to hit the other participant virtually on the colored patches. Each successful hit gives a point. The participant with the highest point wins the game. The detail description is available in here.
Data Traces: The data trace contains 3 tables: CameraData, GatewayInData, and GatewayOutData. The traces are collected at the camera and gateway at the monitoring points (shown by the dotted arrow) show in Figure 2.
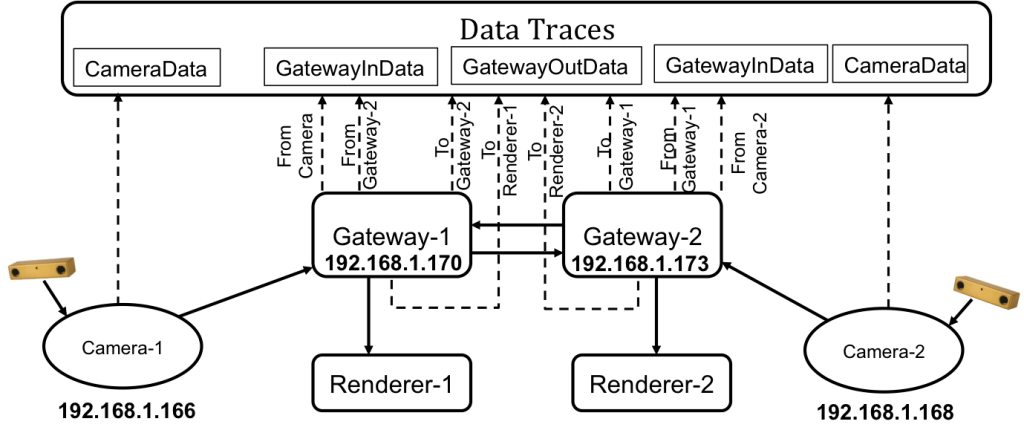
Table 1 shows the fields in each table. A stream is uniquely identified by its FrameID and StreamID fields in all tables.
| Table Name | Fields |
|---|---|
| CameraData | SessionID, CameraID, Timestamp, StreamID, FrameID, FrameSize, CPUUsage, ReconstructionTime, ProcessinTime |
| GatewayInData | SessionID, GatewayID, Timestamp, FrameRate, StreamID, FrameID, FrameSize, CPUUsage, MemUsage |
| GatewayOutData | SessionID, GatewayID, Timestamp, FrameRate, StreamID, FrameID, FrameSize, CPUUsage, MemUsage |
Table 1
Traces Collected in Supercomputing 2012 Demo
To be available on December